Analytics
Use Analytics to see how often people visit your world, which rooms and areas they use, and how much time they spend in conversations. You can also open a member's activity to look at a particular day or session.
The free plan shows global metrics in a preview. Detailed metrics are are available for premium accounts.
Opening Analytics
Click Analytics in the admin sidebar. To open one member's activity directly, click the chart icon (Activity analytics) next to them in the Members table of your world.
Filters
Choose a world and a date range, then click Load activity. Use Room and Area to focus on a location, or select a person under User to open their activity.
- Period: today, the last 7, 30, 60 or 90 days, or custom dates. The default is the last 30 days. Data is kept for 3 months, so a custom range must start within the last 90 days.
- Room and Area: count only what happened in that room or area. In the world overview, with an area selected, presence and visits become time spent in the area and entries into it.
- User: search by name or email, then pick the person.
Days and hours use your browser's timezone. Charts use one point per hour for ranges of up to 72 hours, and one point per day beyond that.
The page does not update on its own: click Load activity again for fresh figures. Results can stay cached for up to 5 minutes.
On a member's page, the area filter applies to conversations, actions and opened content only. Presence, days and sessions still cover the whole world, so their connection time is not time spent in the area.
World overview
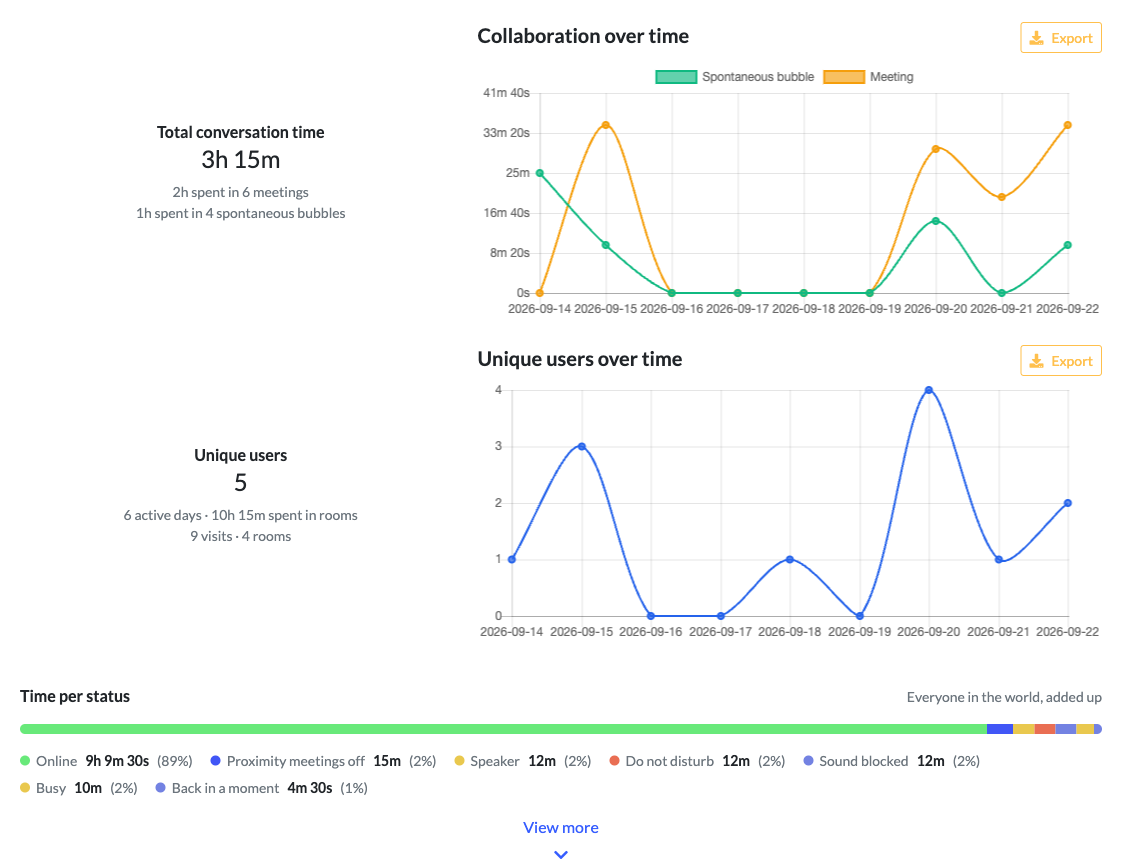
The cards at the top summarize the period:
- Total conversation time: time spent in bubbles and meetings (see how it is counted).
- Unique users: the number of different people who connected, with their active days, visits and time spent in rooms.
- Time per status: time spent Online, Busy, Away, Do not disturb and so on, summed over everyone.
View more adds screenshares, chat messages sent, map editor changes and opened content (links, documents and media). Below the cards, Collaboration over time and Unique users over time chart the same period.
Tabs
- Rooms: conversation time (spontaneous bubble or meeting), connection time, unique users and last activity for each room. Switch between Table and View by room.
- Users: the same figures for each person.
- Areas: time spent in each area, number of people, entries and average visit length.
- Content: the websites, documents and media that were opened, how often, and from which areas. You can filter by media type.
- Actions: screenshares, chat messages, map edits and opened content, with their totals and first and last dates.
- Meetings: the conversations that ended during the period, with their kind, duration and number of people.
Meeting detail
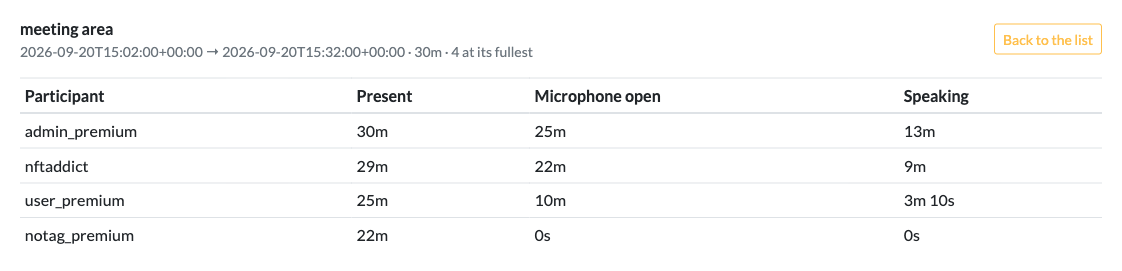
Click Open on a meeting to see its start and end, the highest number of participants present at the same time, and for each participant their Present, Microphone open and Speaking times.
For an external meeting (Teams, Google Meet…), the duration is the time spent in the area that opens the call. The call itself runs in another browser tab and is not measured.
User, day and session pages
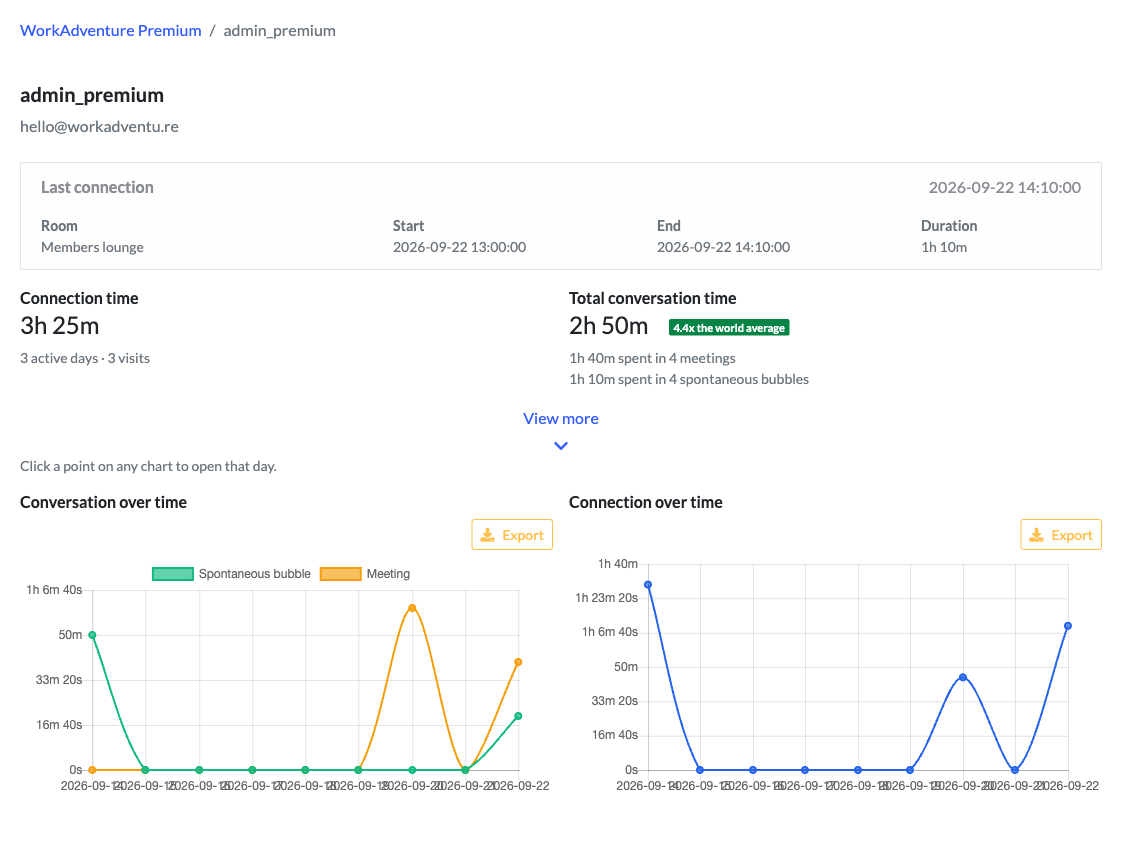
A member's page opens from the Users tab, the User filter or the Members table. It shows:
- their last connection, connection time, and conversation time compared with the world average;
- time spent broadcasting (on air) or listening to a broadcast;
- conversation and connection over time, and days by status;
- a table of days with presence, conversation time, visits, first connection and last disconnection;
- their meetings, rooms, areas, and the documents and media they opened.
Click a point on a chart, or Detail in the days table, to open that day: conversation and actions through the day, and the list of sessions. Open a session to see its timeline: chat, room changes, areas crossed, content opened and meetings joined.
These pages are not available when user-level activity is turned off.
Exporting data
Charts and tables have an Export button that downloads the data shown as a CSV file (UTF-8).
To receive the raw events in your own tools, subscribe a webhook endpoint to analytics.
How metrics are counted
- Connection time runs from opening the world in a tab to closing that tab.
- Conversation time measures time spent in a bubble or meeting, including time spent listening with the microphone off.
- Microphone open measures time with the microphone on, and Speaking measures detected speech while it is on. Both appear in meeting details.
- At world level (overview, charts, Rooms tab), each conversation counts once: a one-hour meeting with five people adds one hour. On a member's page, the person's own time in it is counted. The same difference separates a meeting's Duration, from its start to its end, and each participant's Present time.
- A spontaneous bubble starts when avatars walk up to each other. A meeting takes place in a meeting area. An external meeting opens Teams, Google Meet or another tool in a separate tab.
- Visits count browser tabs: reloading the page or opening the world in a second tab adds a visit. Unique users counts each person once.
- Broadcast time, speaking in or listening to a megaphone, is shown separately and not included in conversation time.
Privacy and data retention
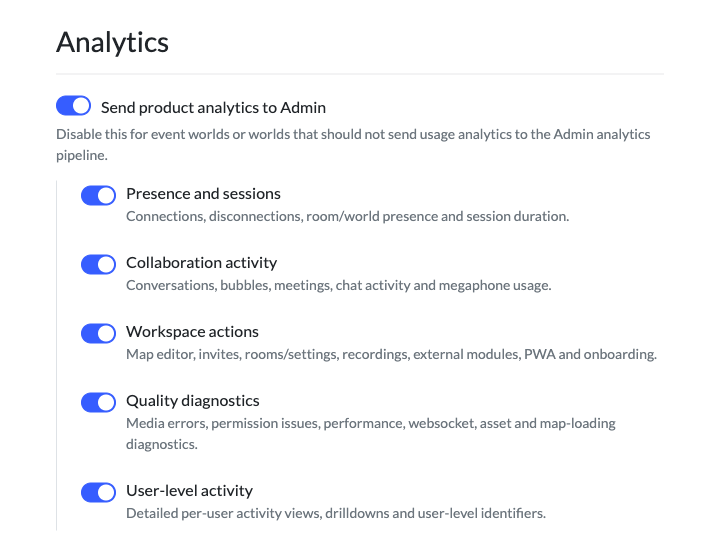
Collection is set per world, in Edit world › Analytics.
Send product analytics to Admin turns collection on or off for the world. It is on by default; you may want to turn it off for a public event world.
While it is on, each category below can be turned off separately. Turning off a category stops collecting new data for it. Previously collected data remains available until it expires.
| Category | What it covers | Needed for |
|---|---|---|
| Presence and sessions | Connections, disconnections, room and world presence, session duration | Connection time, visits, unique users, time per status |
| Collaboration activity | Conversations, bubbles, meetings, chat activity, megaphone usage | Conversation time, the Meetings tab, messages sent, screenshare |
| Workspace actions | Map editor, invites, room settings, recordings, external modules, onboarding | The Areas and Content tabs, map editor and opened content counts |
| Quality diagnostics | Media errors, permission issues, performance and loading diagnostics | Microphone open and Speaking times in meeting details |
| User-level activity | Per-user pages and the identifiers that link activity to a person | See below |
Microphone and speaking times require Quality diagnostics, not Collaboration activity. No new microphone or speaking durations are recorded while this category is off.
Nothing is collected for a category while it is off, so turning it back on does not fill in that period.
When User-level activity is off:
- new data is stored under a pseudonym, without the IP address;
- per-user figures and the user, day and session pages are not available;
- meeting details show participants as "Participant 1", "Participant 2"…
Data collected before you turned it off is hidden, not pseudonymized. Turn the category back on and per-user pages show it again; data collected while it was off stays pseudonymous.
Analytics data is deleted after 3 months.
Your world's generated privacy policy is updated when you change these settings.
Free plan preview
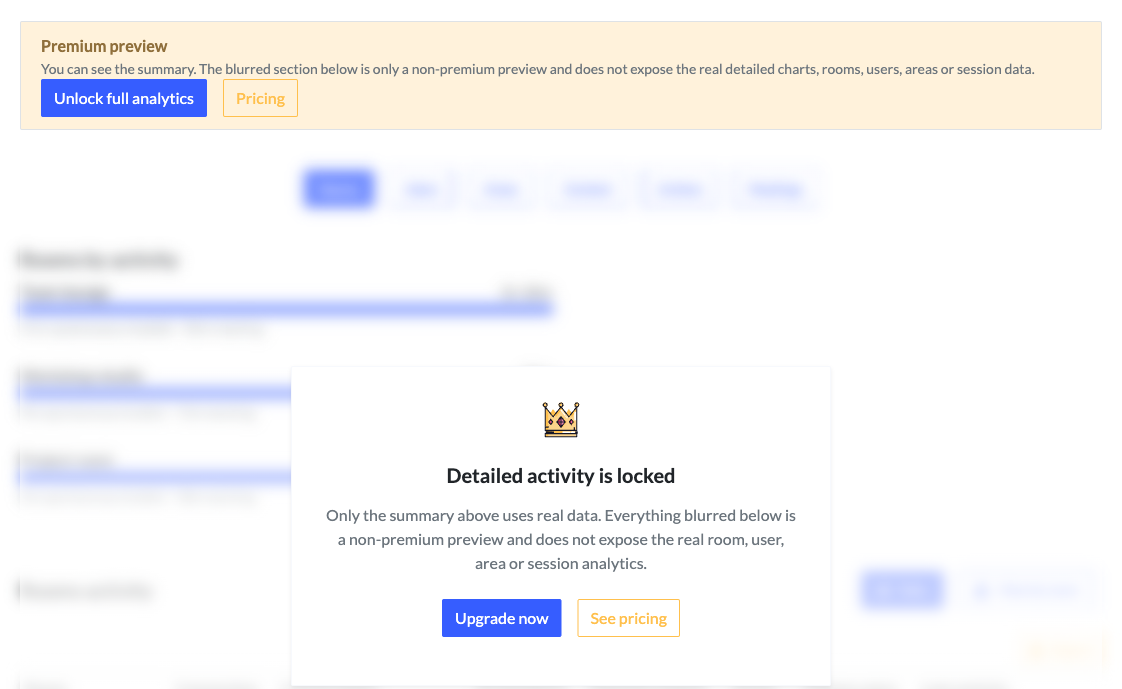
On the free plan, the summary cards and the two charts at the top show your real data. Upgrade to premium to unlock the detailed statistics.